Families and Whānau Status Report
In 2017 I assisted Superu (The Familiies Commission) with their analysis and visualisation of data for the Families and Whānau Status Report.
I developed charts that helped the analysts understand their data better, and then produced final charts for inclusion in the final published report.
Some of the charts included in the report:
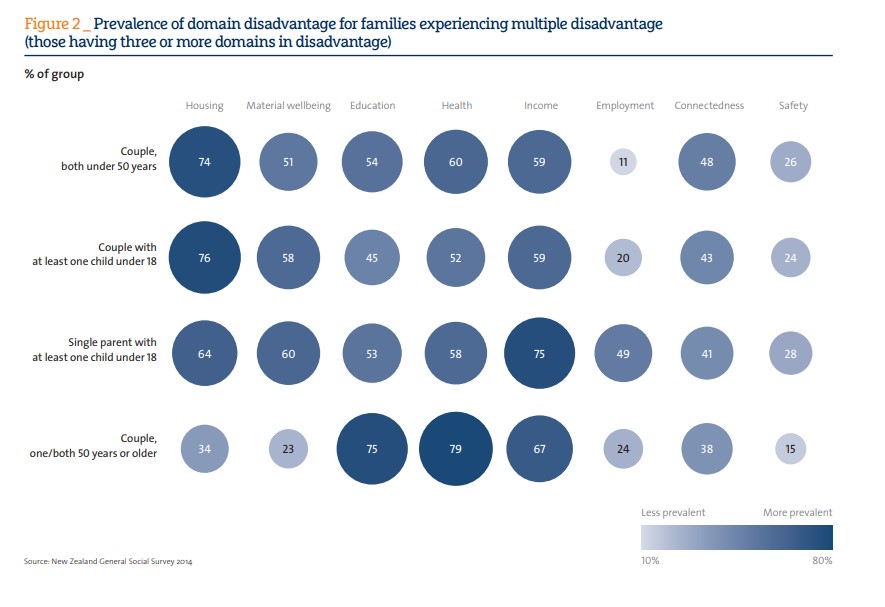
Bubble heat map showing the Prevalence of domain disadvantage for families experiencing multiple disadvantages
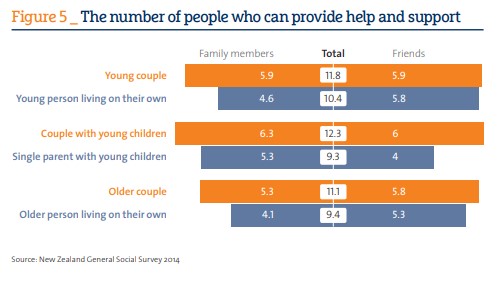
Diverging bar chart showing the number of people who can provide help and support
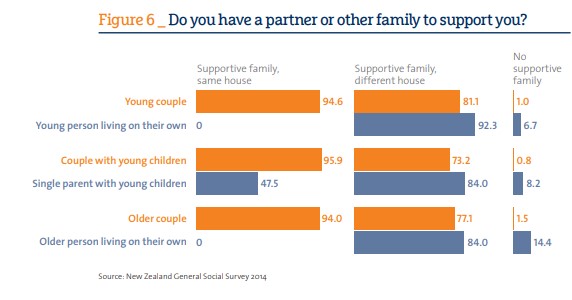
Clustered bar chart showing who has a partner or other family member for support
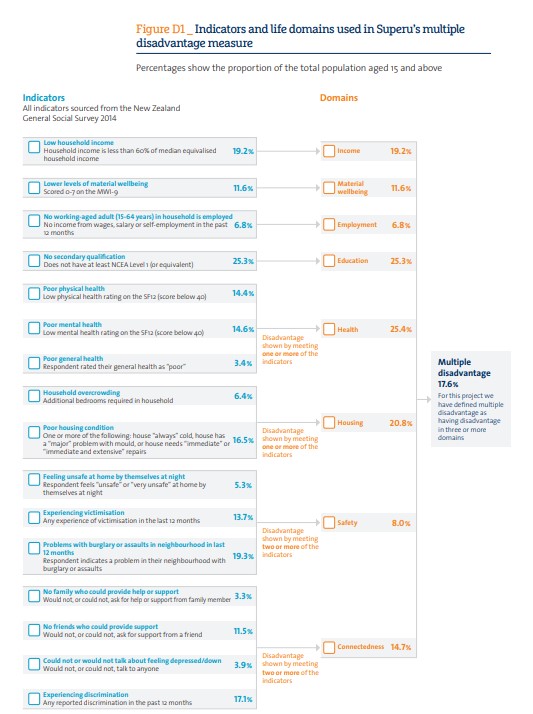
Tree showing Indicators and life domains used in Superu’s multiple disadvantage measure
In addition to the Families and Whānau Status Report, I also contributed designs for charts for the Youth Mental Health Project and Land Use Regulations reports.
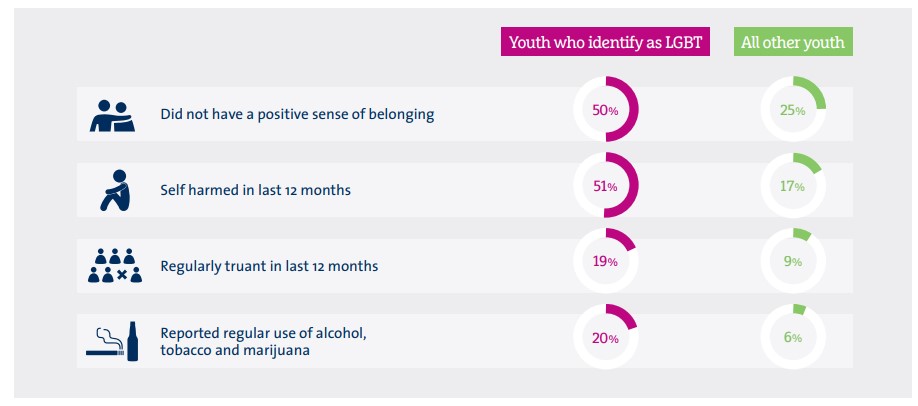
Example chart from the Youth Mental Health Project
Example chart from the Land Use Regulations reports
